FB_init

Wednesday, October 11, 2023

By-passing Facebook's media link blockages


With the Online News Act in Canada, Facebook currently blocks links of certain media. Here is how to by-pass that.

Step 1: copy your original story link. This may be "https://www.marxist.com/down-with-hypocrisy-defend-gaza-imt-statement.htm" for example. 

Step 2: Go to https://www.base64encode.org/ . Paste the link there and click on "Encode". You will get text that looks like this:


aHR0cHM6Ly93d3cubWFyeGlzdC5jb20vZG93bi13aXRoLWh5cG9jcmlzeS1kZWZlbmQtZ2F6YS1pbXQtc3RhdGVtZW50Lmh0bQ==

Copy this text.


Step 3: Go to https://www.urlencoder.org/ . Paste the text from the previous step and click on "Encode". You will get text that looks like this:

aHR0cHM6Ly93d3cubWFyeGlzdC5jb20vZG93bi13aXRoLWh5cG9jcmlzeS1kZWZlbmQtZ2F6YS1pbXQtc3RhdGVtZW50Lmh0bQ%3D%3D

Copy this text.

Step 4: Append the copied text to the link


https://ipfs.io/ipfs/QmRxawN83bVcMq66GpfwxNb49WoPiFxNG7cUfat3kxhMpo?filename=vaivai.html&link= 

So you will have a long link like 

https://ipfs.io/ipfs/QmRxawN83bVcMq66GpfwxNb49WoPiFxNG7cUfat3kxhMpo?filename=vaivai.html&link=aHR0cHM6Ly93d3cubWFyeGlzdC5jb20vZG93bi13aXRoLWh5cG9jcmlzeS1kZWZlbmQtZ2F6YS1pbXQtc3RhdGVtZW50Lmh0bQ%3D%3D 

This is the link that you can share. This link will take readers to the original link with what is called a "redirect". Try it! 

Wednesday, July 14, 2021

Regular expression plug-in for Sublime Text

 I often need to look at logs. I needed a way to quickly highlight different parts of the logs. I created a plugin for Sublime Text to do that. 

  Here are instructions to create a plugins. 

  Here is my plugin:


  You can invoke it with

view.run_command("reggae", {"pattern_args": ["pattern 1", "pattern 2"]}) 

Monday, February 03, 2020

Personalizing searches integrating Elasticsearch with Amazon Personalize

  In this post I'll describe a way to personalize Elasticsearch queries integrating it with Amazon Personalize. The main use case is for Elasticsearch to index products for e-commerce searches. Amazon Personalize, as the name implies, is a system that provides "personalization" to users. In summary, Amazon Personalize can return lists of products recommended for a given user. This list can be ranked too.

  Elasticsearch provides the ability for queries to contain weights and boosts. Elasticsearch uses these numbers as multiplying factors when interpreting the score and, consequently, the ranking of the search results.

  Amazon Personalize has the notion of "item". In most cases an "item" is a product. You will need to decide if it is a base product or a variant/SKU, but I won't elaborate on this topic in this post. In the architecture described, we'll have one instance of Amazon Personalize where an item is a product, and another instance where an item is a category. Many times, e-commerce catalogues are "sparse", in the sense that there are many products with considerable rate of product renewal and shoppers don't have many orders in their order history. While the code will only reference one Personalize instance for categories, it can be easily extended to add another instance for brands.

  The code is in Python, and has a dependency on boto3. The code runs intercepting an Elasticsearch query and injecting product ids and category ids with weights and boosts.

  We begin with a high-level function. For categories and for products, we retrieve recommendations, we rank these recommendations and we inject the weights and boosts into the Elasticsearch query:


  How do we know that the recommended products returned by Amazon Personalize will be related to the query? Well, we don't know. We can keep in mind the principle of generality of the query. If the query is general (searching for "electronics"), then personalization can have more "influence". Conversely, if the query is specific (searching for "an iPod with 32 Gb of memory"), then personalization should not have much "influence". The code presented here could be extended such that when there are facets included in the query, then the retrieval of product recommendations from Personalized is skipped, while leaving the calls to retrieve recommendations for categories and brands.

  These are the basic functions that retrieve recommendations from Personalize:

  These are our functions that retrieve the ranking from Personalize:

  Another detail of the architecture is that there are two campaigns for products and two campaigns for categories. The first campaign has recipe "hrnn" (for recommendations) and the second campaign has recipe "rank" (for ranking).

  The code assigns weights to products in descending order, based on the ranking returned by Personalize. The initial weight and the "step" can be tuned according to the data.

  The most important function is the one that injects the boost and weight values into the Elasticsearch query.


This is the complete source code with sample configuration:

  Disclaimers:
  The code above is provided as-is. The author assumes no responsibility for the misuse of the code.
  The code above was created by the author for Pivotree, while an employee of Pivotree. The blog post and code fragments are shared here publicly with permission.


Saturday, August 24, 2019

Amazon on Fire

Translation of a note by Erika Berenguer (mostly done by Google Translate):

"I have been working in the Amazon for 12 years and for 10 years I have been researching the impacts of fire on the largest rainforest in the world. My doctorate and my postdoc were on it, and I've seen the forest burning under my feet more often than I'd like to remember. So I feel obliged to bring some clarifications as a scientist and as a Brazilian, since for most people the Amazon reality is so distant:

First, and most importantly, fires in the Amazon rainforest do not occur naturally - they need a source of human-made ignition or, in other words, for someone to put the fire out. Unlike other ecosystems, such as the Cerrado, the Amazon has NOT evolved with fire and this is NOT part of its dynamic. This means that when the Amazon catches fire, a huge part of its trees die because they have no fire protection at all. When they die, these trees then decompose, releasing into the atmosphere all the carbon they stored, thus contributing to climate change. The problem with this is that the Amazon stores a lot of carbon in its trees, the entire forest stocks the equivalent of 100 years of US CO2 emissions, so burning the forest means putting a lot of CO2 back into the atmosphere.

The fires, which are necessarily caused by man, are of two types: the one used to clear the fields and the one used to clear an area; what we are seeing is of the second kind. In order to clear the forest, it is first cut down, usually with what is called a correntão - two tractors linked by a huge chain, so with the tractors walking, the chain between them is bringing the forest to the ground. The forest fell for a while on the ground drying, usually months into the dry season, because only then the vegetation loses enough moisture to be able to set fire to it, making all that vegetation disappear, and then it is possible to plant grass. The great fires that we are seeing now that made the sky of São Paulo darken represent this last step in the dynamics of deforestation - turning the fallen forest to ashes.

In addition to the loss of carbon and biodiversity caused by deforestation itself, there is also a more invisible loss - that which occurs in burned forests. The fire from deforestation can escape to un deforested areas and if it is dry enough, it can also burn the standing forest. A forest that then stores 40% less carbon than previously stored, and again carbon that has been lost to the atmosphere. The burnt forests are no longer a lush green, life-littering, and the cacophony of sounds from various animals is muted - the forest acquires shades of browns and grays, with the only sounds being those of falling trees.

The dry season in the Amazon has always brought burns and for years I have been trying to draw attention to forest fires like those of 2015 when the forest was exceptionally dry due to El Niño. What's different this year is the scale of the problem. It is the increase of deforestation coupled with the numerous outbreaks of burning and the increase of carbon monoxide emissions (which shows that the forest is burning), which culminated in the black rain in São Paulo and the diversion of flights from Rondônia to Manaus, cities a mere thousand kilometers away. And the most alarming thing about this whole story is that we are at the beginning of the dry season. In October, when the peak of the dry season in Pará reaches its peak, the tendency is unfortunately for the situation to get much worse.

In 2004 Brazil reached 25000 km2 of deforested forest in the year. Since then we have reduced this rate by 70%. It is possible to curb and combat deforestation, but it depends as much on societal pressure as on political will. It is up to the government to take responsibility for current deforestation rates and stop speeches that promote impunity in the countryside. It must be understood that without the Amazon there is no rain in the rest of the country, seriously compromising our agricultural production and our power generation. It must be understood that the Amazon is not a bunch of trees together, but our greatest asset.

It is an indescribable pain to see the largest rainforest in the world, my object of study, and my own country burn. The barbecue filled with the deep silence in a burnt forest are not images that will ever get out of my head. It was a trauma. But on the current scale, you won't need to be a researcher or resident of the region to feel the pain of losing the Amazon. The ashes of our country now seek us even in the great metropolis."

Sunday, November 18, 2018

PySpark: references to variable number of columns in UDF


Problem statement:

  Suppose that you want to create a column in a DataFrame based on many existing columns, but you don't know how many columns, possibly because that will be given by the user or another software.

This is how you can do it:

Saturday, November 17, 2018

PySpark: Concatenate two DataFrame columns using UDF


Problem Statement:
  Using PySpark, you have two columns of a DataFrame that have vectors of floats and you want to create a new column to contain the concatenation of the other two columns.

This is how you can do it:

Thursday, November 15, 2018

PySpark, NLP and Pandas UDF


Problem statement:
  Assume that your DataFrame in PySpark has a column with text. Assume that you want to apply NLP and vectorize this text, creating a new column.

This is how to do it using @pandas_udf.


spaCy is the NLP library used ( see https://spacy.io/api/doc ). nlp(astring) is the call that vectorizes the text. The s.fillna("_NO_₦Ӑ_").replace('', '_NO_ӖӍΡṬΫ_') expressions fill in missing data.

Now you can create a new column in the dataframe calling the function.


For more information on Pandas UDF see
https://databricks.com/blog/2017/10/30/introducing-vectorized-udfs-for-pyspark.html

Tuesday, November 13, 2018

Pandas UDF for PySpark, handling missing data


Problem statement:
  You have a DataFrame and one column has string values, but some values are the empty string. You need to apply the OneHotEncoder, but it doesn't take the empty string.

Solution:
  Use a Pandas UDF to translate the empty strings into another constant string.

First, consider the function to apply the OneHotEncoder:

Now the interesting part. This is the Pandas UDF function:

And now you can create a new column and apply the OneHotEncoder:


For more information, see https://databricks.com/blog/2017/10/30/introducing-vectorized-udfs-for-pyspark.html and http://pandas.pydata.org/pandas-docs/stable/generated/pandas.Series.str.replace.html#pandas.Series.str.replace .

This is the exception you get if you don't replace the empty string:

   File "/Users/vivaomengo/anaconda/lib/python3.6/site-packages/py4j/java_gateway.py", line 1257, in __call__
    answer, self.gateway_client, self.target_id, self.name)
  File "/Users/vivaomengo/anaconda/lib/python3.6/site-packages/pyspark/sql/utils.py", line 79, in deco
    raise IllegalArgumentException(s.split(': ', 1)[1], stackTrace)
pyspark.sql.utils.IllegalArgumentException: 'requirement failed: Cannot have an empty string for name.'


Tuesday, September 25, 2018

Pastora Tânia Tereza Carvalho e o Deus estuprador


   Ouvi a Pastora Tânia Tereza Carvalho nesse final de semana aqui em Ottawa por várias horas. De acordo com a Pastora Tânia, Deus é um carrasco que pune especialmente os "pecados sexuais". Se houver algo de errado na sua vida, é algum pecado cometido por você ou por algum antepassado. Comece sentindo-se culpada primeiro. Depois ore a oração da Pastora Tânia para quebrar a maldição. Mas tome muito cuidado porque o Deus estuprador está em todos os lugares e tudo vê. Ele está também no seu lobo frontal.
   Não obstantes os alívios efêmeros, essa tormenta nunca terá fim, amiga crente. Paulo já gritava desesperado dizendo "miserável homem que sou". Santo Agostinho quando menino roubou peras de seu vizinho. O peso e a culpa desse pecado renderam sete capítulos em seu livro Confissões. A tensão entre corpo e espírito afligia os barrocos.
   A Pastora Tânia teve uma infância sofrida. Foi abandonada pelos pais e abusada. Diante do absurdo da violência e da dor, a resposta é uma segunda tristeza: a justificativa irracional. Depois que Deus assediá-la moralmente e abusá-la no lugar mais íntimo, a saber, no seu próprio ser, o Justo Juíz não será nem julgado. E a culpa é sua.


Thursday, September 20, 2018

E-Commerce, AI and Societal Challenges - my talk at Data Day 5.0 at Carleton University

This was my talk at Data Day 5.0 at Carleton University on 5/Jun/2018.

  One of the applications of Big Data and E-commerce that we have been working on is a product recommender. While the Universal Recommender is independent of e-commerce platform, we tested it with Oracle ATG Web Commerce and SAP Hybris Commerce.
  The Universal Recommender models any number of product properties and user properties, as well as user actions in relation to products such as 'view-product', 'add-to cart' and 'purchase'.
  Often in e-commerce, only a portion of product catalogues change frequently, like price and stock, while new shopper events appear gradually. One of the things we would like to explore is reinforcement learning, trying to model deltas and events for better use of computation resources.
  One problem in e-commerce that may be common to other domains in Machine Learning is that of data modeling. While the Universal Recommender leverages product and user features, the data representation cannot leverage the inherent hierarchical property of product categories, for instance.
  Another challenge with data representation is that of base products versus variants. For example, a shirt can be a base product, but the buying unit, or SKU, may be a large green shirt. And products can also be configurable, like a hamburger.
  I'd like to list other functionality where Big Data and Machine Learning can help e-commerce systems. Search results can be seen as the output of a recommender system. When APIs are exposed on the Internet, hackers can try to steal login information or reward points or abuse of promotions. Machine Learning can be used to detect malicious requests. This problem is not specific to e-commerce: the approach can be used in micro-services in general. Machine Learning can also be used to better detect credit card fraud. Another challenge in e-commerce is the verification of product reviews. Detecting cart abandonment is another application of Machine Learning. In Product Information Management, classification algorithms and NLP can automate product categorization, specially for large catalogues and B2B sites integrating external vendor catalogues. Classification algorithms and NLP with sentiment analysis can help Customer Care with case tagging, case prioritization and dispute resolution.
  A recent development in the area of e-commerce and legislation is The European Union General Data Protection Regulation is designed to protect the data privacy of all European residents and requires website operators, among other requirements, to consider any applicable notice and consent requirements when collecting personal data from shoppers (for example, using cookies). GDPR not only applies to organizations located within Europe, but it also applies to organizations located outside of it, if they offer goods or services to European shoppers. It came into effect May 25th of this year and it defines fines for non-compliance. GDPR in my view includes a bigger scope of rights and protections when compared with the Personal Information Protection and Electronic Documents Act that we currently have in Canada. Thanks to GDPR, for example, we now know that PayPal shares personal data with more than 600 third party organizations. Of particular interest to Machine Learning are the rights in relation to automated decision making and profiling. Quoting Mr. Andrew Burt: "The GDPR contain a blanket prohibition on the use of automated decision-making, so long as that decision-making occurs without human intervention and produces significant effects on data subjects." One exception is when the user consents explicitly. One issue is the interpretation of what can be called "rights to explainability", that is, rights to explain the algorithm, its model and reason considering ML algorithms and models can be difficult to explain. Another challenge is the right to erasure. Should the ML model be retrained after the user asks to delete her or his data? The Working Party 29, an official European group involved in drafting and interpreting the GDPR, understands that all processing that occurred before the withdrawal remains legal. However, a more critical view could argue that the model is directly derived from the data and can even reveal the data with overfitting in some cases.
  The first international beauty contest judged by AI accepted submissions from more than 6,000 people from more than 100 countries. Out of the 44 winners, nearly all were white women. In the United States, software to predict future criminal activity was found to be biased against African-Americans. In these cases, as in others, societal prejudices made their way into algorithms and models. Let's not forget that software systems are built in certain contexts and deployed into contexts. The international beauty contest reveals a naïveté: as if software could reveal a culturally neutral and racially neutral conception of beauty. A coalition of human rights and technology groups at the RightsCon Conference a few weeks ago drafted what is called "The Toronto Declaration". RightsCon covered a broad list of important subjects related to AI and society. The Toronto Declaration emphasizes the risk of Machine Learning systems to "intentionally or inadvertently discriminate against individuals or groups of people". It reads:
"Intentional and inadvertent discriminatory inputs throughout the design, development and  use of machine learning systems create serious risks for human rights; systems are for the most part developed, applied and reviewed by actors which are largely based in particular countries and regions, with limited input from diverse groups in terms of race, culture, gender, and socio-economic backgrounds. This can produce discriminatory results."
Standford's University One Hundred Year Study on Artificial Intelligence is a long-term investigation of AI and its influences in society. Section 3 of its latest report - "Prospects and Recommendations for Public Policy" -   calls to "Increase public and private funding for interdisciplinary studies of the societal impacts of AI.
As a society, we are underinvesting resources in research on the societal implications of AI technologies."
  Thinking of societal issues raised by AI and automation, I chose to quickly mention the issue of employment. One good article by Dr. Ewan McGaughey titled "Will Robots Automate Your Job Away? Full Employment, Basic Income, and Economic Democracy" argues that robots and automation are not a primary factor of unemployment. He writes: "once people can see and understand the institutions that shape their lives, and vote in shaping them too, the robots will not automate your job away. There will be full employment, fair incomes, and a thriving economy democracy. "
  My best friend is a professor of Machine Learning. He's funny and at times even sarcastic. One day he described to me a hypothetical conversation with a Philosopher. "When I submit applications for grants, I ask for hardware and software for my lab. What do you ask for? A chair?" The Philosopher Thomas Khun could have replied: 'New science gets accepted, not because of the persuasive force of striking new evidence, but because old scientists die off and young ones replace them.' The enveavour of modeling and interpreting zeros and ones is epistemic and hermeneutic. The time is not for isolation, but for collaboration. More than ever we need to engage the Social Sciences and the Humanities to help us understand what we do, how we do it and why we do it.

Friday, May 11, 2018

Dados abertos - Câmara Legislativa - chamados REST e arrays

No primeiro post (
http://gustavofrederico.blogspot.ca/2016/12/dados-abertos-camara-legislativa.html ) eu mostrei como usar os dados da Câmara numa planilha do Google.

Nesse post, mostro como fazer a mesma coisa, mas usando um tipo de chamado diferente do anterior, e usando arrays. Vejamos o que é cada uma dessas coisas.

No primeiro post, a planilha do Google chamava o web service da Câmara. O serviço da Câmara retornava um dado do tipo XML. Nesse exemplo, como veremos, chamaremos um serviço do tipo REST. Tanto REST quanto web services são tipos de serviços muito comuns na informática.

Nesse exemplo também mostro como usar um array. Um array é uma lista de valores. O serviço REST da Câmara retorna dados no formato "JSON", sendo que certos dados são do tipo array. Esse array, isto é, essa lista de valores aparecerá na planilha como uma sequência de células ("range" em Inglês).

Começamos da mesma maneira. Na planilha do Google, para criar uma fórmula customizada, vá no menu "Ferramentas" -> Editor de scripts... 

Crie uma função chamada obterDetalheEvento, como na imagem abaixo.


A função chama um serviço REST da Câmara Legislativa que lê dados de eventos. Veja os detalhes desse chamado na documentação aqui:

https://dadosabertos.camara.leg.br/swagger/api.html

A função retorna um array ( a lista de dados ). Veja como utilizar a função abaixo:


Como a função retorna um array, a planilha do Google preenche as células abaixo da fórmula com valores. Os argumentos da função incluem referências a células na planilha. O último argumento, (titulo, descricaoSituacao, dataHoraInicio, etc, por exemplo) são referências a chaves no JSON retornado pelo serviço da Câmara. Para saber como é esse JSON retornado, veja a documentação novamente em https://dadosabertos.camara.leg.br/swagger/api.html .

Só para se ter uma ideia, aqui está uma parte dos dados em formato JSON retornados pelo serviço:


Nota sobre tipo de dados:
A fórmula obterDetalheEvento como demonstrada usa valores de datas como string. (B5 e B6 no exemplo) É importante "forçar" o uso da data nas células como string, senão haverá um problema de tipos na fórmula. Para "forçar" as datas como string, use o caracter de aspas simples (')  no início do valor na fórmula.

Tuesday, February 28, 2017

Analyzing request rates using R

Problem statement
A server exposes an API on the Internet, serving requests. A request has a certain IP as origin. The question is: how should one configure limits on the web server to avoid abusive requests? 'Abusive requests' are a series of requests that happen in bursts of a 'high rate' per second. Nginx allows one to limit request rates. See http://nginx.org/en/docs/http/ngx_http_limit_req_module.html . Above the threshold, Nginx responds with HTTP error 503.

General approach
The general approach is to load web server log data and to measure the request rates from it. After tabulating the data, we can decide what rates are 'abusive'. We'll configure Nginx with 
 limit_req_zone $binary_remote_addr  
meaning that it will apply the request rate limit to the source IP.

Tools
We'll use some Unix commands to pre-process the log files. If you are using Windows, consider installing Cygwin. See https://cygwin.com/install.html .
For R, we can use either a Jupyter notebook or R Studio. Jupyter was useful to organize the commands in sequence, while R Studio was useful to try ad-hoc commands on the data. Both Jupyter notebooks and R Studio are included in Anaconda Navigator. Begin with the "Miniconda" install. See https://conda.io/miniconda.html .


Install R Studio and Jupyter notebook from Anaconda Navigator.

Pre-processing the web server logs
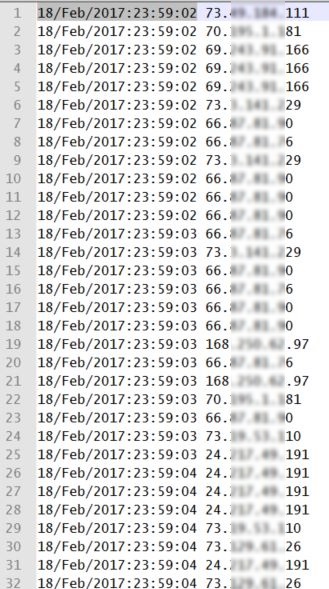
The log files have lines including many information. We just need the date+time and source IP.

We cut twice, first on double-quotes, then on whitespace. Then we remove some extra characters if needed.


 cut -d "\"" -f1,8 fdpapi_ssl_access_w2_21.log | cut -d " " -f4,6 | sed 's/\[//' | sed 's/,//' | sed 's/\"//' > fdpapi_ssl_access_w2_21.csv  


The end result are lines with just the date+time and source IP.


Analysing the logs

The first lines of the R script load the csv file. Then, sort the rows by IP.


 library(readr)  
 logrows <- read_delim("~/TGIF_work/nginx_thr_FDPCARE-325/fdpapi_ssl_access_w_tutti.csv",   
   " ", escape_double = FALSE, col_names = FALSE,   
   col_types = cols(`coldatetime` = col_datetime(format = "%d/%b/%Y:%H:%M:%S"),   
     X1 = col_datetime(format = "%d/%b/%Y:%H:%M:%S")),   
   trim_ws = TRUE)  
 logrows <- logrows[order(logrows$X2),]  

You can peek into the log rows.
head(logrows)

X1X2
2017-02-19 00:00:04100.0.XX.244
2017-02-19 00:03:51100.1.XXX.223
2017-02-19 00:03:52100.1.XXX.223
2017-02-19 00:02:48100.1.XXX.60


R has a special type called 'factor' to represent unique 'categories' in the data. Each element in the factor is called a 'level'. In our case, unique IPs are levels.


 tb <- table(logrows$X2)   

 ipsfactor <- factor(logrows$X2, levels = names(tb[order(tb, decreasing = TRUE)]))  


Let us define a function to translate the request times into numbers (minutes) relative to the first request. Then, make a histogram of the requests, placing them into 'bins' of one minute.


 # x is a vector with the datetimes for a certain IP  

 findfreq <- function(x) {  
   thesequence <- as.numeric(x-min(x), units="mins")  
   hist(thesequence, breaks = seq(from = 0, to = ceiling(max(thesequence))+1, by=1), plot=FALSE)$counts  
 }  


Here we could count the frequency of IPs using the factor and the function. That is, we could apply the function for each IP. This would allow for the visualization of an 'intermediary' step of the process.


 # Intermediary steps  

 # ipscount <- tapply(logrows$X1, ipsfactor, findfreq, simplify=FALSE)  
 # ttipscount <- t(t(ipscount))  


Transposing the array twice simplifies the visualization.
Let's now define another similar function that only keeps the maximum.


 findmaxfreq <- function(x) {  
   max(findfreq(x))  
 }  

Aggregate the data using the new function.


 ipsagg <- aggregate( logrows$X1 ~ ipsfactor, FUN = findmaxfreq )  

Display the top IPs sorted by requests per minute descending. These are the 'top abusers'. The table shows that IP 51.XXX.56.29 sent 1160 requests per minute at one point.


 head(ipsagg[order(ipsagg$`logrows$X1`, decreasing = TRUE),])  


ipsfactorlogrows$X1
51.XXX.56.291160
64.XX.231.130711
64.XX.231.169705
68.XX.69.191500
217.XXX.203.205462
64.XX.231.157458

Display quantiles from 80% to 100%


 quantile(ipsagg$`logrows$X1`, seq(from=0.99, to=1, by=0.001))  


This table is saying that 99.6% of the IPs had the max request rate of 63 requests per minute or less. Plot the quantiles.


 ipsaggrpm <- ipsagg$`logrows$X1`  
 n <- length(ipsaggrpm)  
 plot((1:n - 1)/(n - 1), sort(ipsaggrpm), type="l",  
 main = "Quantiles for requests per minute",  
 xlab = "Quantile fraction",  
 ylab = "Requests per minute")  


As you can see in the quantiles table and the graph, there is a small percentage of 'abusive' source IPs. 

Web server request limit configuration
Fron Nginx documentation: " If the requests rate exceeds the rate configured for a zone, their processing is delayed such that requests are processed at a defined rate. Excessive requests are delayed until their number exceeds the maximum burst size in which case the request is terminated with an error 503 (Service Temporarily Unavailable). By default, the maximum burst size is equal to zero. ". In this sample case, considering that 99.6% of the IPs issued 63 requests per minute or less, considering each source IP, we can set the configuration as follows:

  limit_req_zone $binary_remote_addr zone=one:10m rate=63r/m;  
  ...   
  limit_req zone=one burst=21;  

And burst is set to one-third of 63 requests per minute. This is considering one web server. If a Load Balancer is forwarding requests evenly to two servers, consider half of the values above:


  limit_req_zone $binary_remote_addr zone=one:10m rate=32r/m;  
  ...   
  limit_req zone=one burst=11;  

Useful links
Matrix Operations in R
Dates and Times in R
Dates and Times Made Easy with lubridate - I didn't have to use lubridate, but I "almost" did.
Quantiles

Download the Jupyter notebook with the R script
You can download the Jupyter notebook with the R script here: https://1drv.ms/u/s!ArIEov4TZ9NM_HBIav7QiNR28Gmu

Saturday, December 10, 2016

Dados abertos - Câmara Legislativa - Proposições

Como fazer uma Planilha do Google com dados abertos da Câmara Legislativa. Nesse exemplo uso uma fórmula customizada. Esse é o resultado final:

Note o uso de uma fórmula customizada:


Para criar uma fórmula customizada, vá no menu "Ferramentas" -> Editor de scripts...


Crie uma função chamada obterProposicao, como na imagem abaixo. A função chama um webservice da Câmara usando a classe UrlFetchApp ( ver https://developers.google.com/apps-script/reference/url-fetch/url-fetch-app ). O webservice retorna XML que pode ser interpretado.


Porque o XML nesse caso tem uma estrutura simples só de um nível, um argumento chamado "elemento" declara "o que pegar do XML". Para ver os detalhes dos webservices da Câmara Legislativa, veja

http://www2.camara.leg.br/transparencia/dados-abertos/dados-abertos-legislativo

e

http://www2.camara.leg.br/transparencia/dados-abertos/dados-abertos-legislativo/webservices/proposicoes-1/obterproposicao

Enquanto o exemplo acima funcione, há uma melhoria e uma pergunta. Um problema é que cada referência à fórmula customizada na planilha chama o webservice uma vez. O ideal seria reduzir o número de chamadas ao webservice - se possível uma vez só pra planilha inteira - usando intervalos ( "ranges" ) de células. A pergunta é: quando é que as fórmulas são interpretadas e os dados são atualizados? Não achei a resposta muito facilmente. Em um post futuro mostrarei melhorias à solução resolvendo essas duas questões.


Dados abertos - webservices da Câmara Legislativa

  Estou olhando os webservices da Câmara Legislativa. A Câmara tem uma iniciativa de dados abertos. O requisito é ajudar algumas instituições da sociedade civil e indivíduos interessados a seguir mais detalhadamente o processo e tramitação de proposições da Câmara. Imagine que uma pessoa pode abrir uma planilha, entrar dados básicos de um Projeto de Emenda Constitucional (PEC) ou projeto de lei, clicar num menu ou entrar uma fórmula e os detalhes mais recentes do projeto de lei ou PEC aparecem dentro da planilha.

   Começo listando alguns links essenciais:

Dados abertos do Legislativo:

http://www2.camara.leg.br/transparencia/dados-abertos/dados-abertos-legislativo

Pesquisa simplificada:

http://www.camara.leg.br/buscaProposicoesWeb/pesquisaSimplificada

Debate:

 - O "pedido" foi de usar Excel. Mas como eu não tenho licença, olhei um pouco OpenOffice. Link principal: http://www.openoffice.org/development/ . Achei que eu ia demorar um pouco pra ver como usar a API. E também provavelmente ficasse complicado de usar o OpenOffice em Inglês ou de referir-se à documentação em Inglês para outras pessoas.

- Preferi usar o Google Sheets com Google Apps Script.

Links básicos:

https://developers.google.com/apps-script/guides/services/external

https://developers.google.com/apps-script/quickstart/docs

https://developers.google.com/apps-script/guides/sheets

https://developers.google.com/apps-script/quickstart/macros

https://developers.google.com/apps-script/reference/url-fetch/
 

Sunday, July 31, 2016

Installing ActionML PIO + UR - HBase problem


After following instructions to install ActionML's PIO on a single server, I get this error:

[INFO] [Console$] Inspecting PredictionIO...
[INFO] [Console$] PredictionIO 0.9.7-aml is installed at /usr/local/pio-aml
[INFO] [Console$] Inspecting Apache Spark...
[INFO] [Console$] Apache Spark is installed at /usr/local/spark
[INFO] [Console$] Apache Spark 1.6.1 detected (meets minimum requirement of 1.3.0)
[INFO] [Console$] Inspecting storage backend connections...
[INFO] [Storage$] Verifying Meta Data Backend (Source: ELASTICSEARCH)...
[INFO] [Storage$] Verifying Model Data Backend (Source: HDFS)...
[INFO] [Storage$] Verifying Event Data Backend (Source: HBASE)...
[ERROR] [RecoverableZooKeeper] ZooKeeper exists failed after 1 attempts
[ERROR] [ZooKeeperWatcher] hconnection-0x26fb4d06, quorum=localhost:2181, baseZNode=/hbase Received unexpected KeeperException, re-throwing exception
[WARN] [ZooKeeperRegistry] Can't retrieve clusterId from Zookeeper
[ERROR] [StorageClient] Cannot connect to ZooKeeper (ZooKeeper ensemble: localhost). Please make sure that the configuration is pointing at the correct ZooKeeper ensemble. By default, HBase manages its own ZooKeeper, so if you have not configured HBase to use an external ZooKeeper, that means your HBase is not started or configured properly.
[ERROR] [Storage$] Error initializing storage client for source HBASE
[ERROR] [Console$] Unable to connect to all storage backends successfully. The following shows the error message from the storage backend.
[ERROR] [Console$] Data source HBASE was not properly initialized. (io.prediction.data.storage.StorageClientException)
[ERROR] [Console$] Dumping configuration of initialized storage backend sources. Please make sure they are correct.
[ERROR] [Console$] Source Name: ELASTICSEARCH; Type: elasticsearch; Configuration: HOME -> /usr/local/elasticsearch, HOSTS -> localhost, PORTS -> 9300, CLUSTERNAME -> some-cluster-name-thinkwrap, TYPE -> elasticsearch
[ERROR] [Console$] Source Name: HBASE; Type: (error); Configuration: (error)
[ERROR] [Console$] Source Name: HDFS; Type: hdfs; Configuration: TYPE -> hdfs, PATH -> hdfs://some-master:9000/models


Friday, July 15, 2016

Installing ActionML PIO + UR - surprise downloading dependency Scala jar


I'm following the upgrade document from http://www.actionml.com/docs/install to get ActionML installed/upgraded ( see previous posts ). When running ./make-distribution.sh I get this error:


[info] [SUCCESSFUL ] org.scala-lang#jline;2.10.4!jline.jar (792ms)
[info] downloading https://repo1.maven.org/maven2/org/fusesource/jansi/jansi/1.4/jansi-1.4.jar ...
[info] [SUCCESSFUL ] org.fusesource.jansi#jansi;1.4!jansi.jar (232ms)
[warn] ::::::::::::::::::::::::::::::::::::::::::::::
[warn] ::              FAILED DOWNLOADS            ::
[warn] :: ^ see resolution messages for details  ^ ::
[warn] ::::::::::::::::::::::::::::::::::::::::::::::
[warn] :: org.scala-sbt#ivy;0.13.7!ivy.jar
[warn] ::::::::::::::::::::::::::::::::::::::::::::::
sbt.ResolveException: download failed: org.scala-sbt#ivy;0.13.7!ivy.jar
at sbt.IvyActions$.sbt$IvyActions$$resolve(IvyActions.scala:278)
at sbt.IvyActions$$anonfun$updateEither$1.apply(IvyActions.scala:175)
at sbt.IvyActions$$anonfun$updateEither$1.apply(IvyActions.scala:157)
at sbt.IvySbt$Module$$anonfun$withModule$1.apply(Ivy.scala:151)
at sbt.IvySbt$$anonfun$withIvy$1.apply(Ivy.scala:128)
at sbt.IvySbt.sbt$IvySbt$$action$1(Ivy.scala:56)
at sbt.IvySbt$$anon$4.call(Ivy.scala:64)
at xsbt.boot.Locks$GlobalLock.withChannel$1(Locks.scala:93)
at xsbt.boot.Locks$GlobalLock.xsbt$boot$Locks$GlobalLock$$withChanne


I have a fast and reliable Internet connection here at the office. Retrying resolved the problem.

ActionML PredictionIO upgrade - tricky details

I'm trying to install ActionML PredictionIO and the Universal Recommender ( see previous posts ). Now I'm following the documentation to upgrade at http://www.actionml.com/docs/install .
Some tricky details:
  - The documentation has a step with sudo su aml that will switch to the aml user. Later on it has steps such as rm -r ~/.ivy2, but you should remember not to run as the aml user!

- The documentation tells you to run ./make-distribution but they meant ./make-distribution.sh instead.


PredictionIO: Upgrading or Installing?


  After installing ActionML's PredictionIO + Universal Recommender with the "quick install" methods failed, I'm told by someone in the discussion group that I must "upgrade". And so I go to
http://www.actionml.com/docs/install


It's not clear if this page is for installing fresh or upgrading. The page has an "Upagrade"  section and a "Install Fresh" section after, in the middle of the page.